01 / Trace Context
Every request gets a business trace and an OTEL trace.
DocIntel returns `X-Trace-Id` for application-level review and `X-OTel-Trace-Id` for distributed tracing across backend, MCP, HTTP calls, retrieval, and model operations.
 Agomonia LabsAgentic AI Platform Studio
DocIntel Observability
ADAR DocIntel Observability uses OpenTelemetry to trace document, speech, video, RAG, MCP, chat, ingestion, embedding, retrieval, reranking, LLM, and vertical workflows end to end. Each request gets a DocIntel trace ID and OTEL context, while spans capture timing, status, metadata, model usage, errors, and redacted operational details.
High-Level Workflow
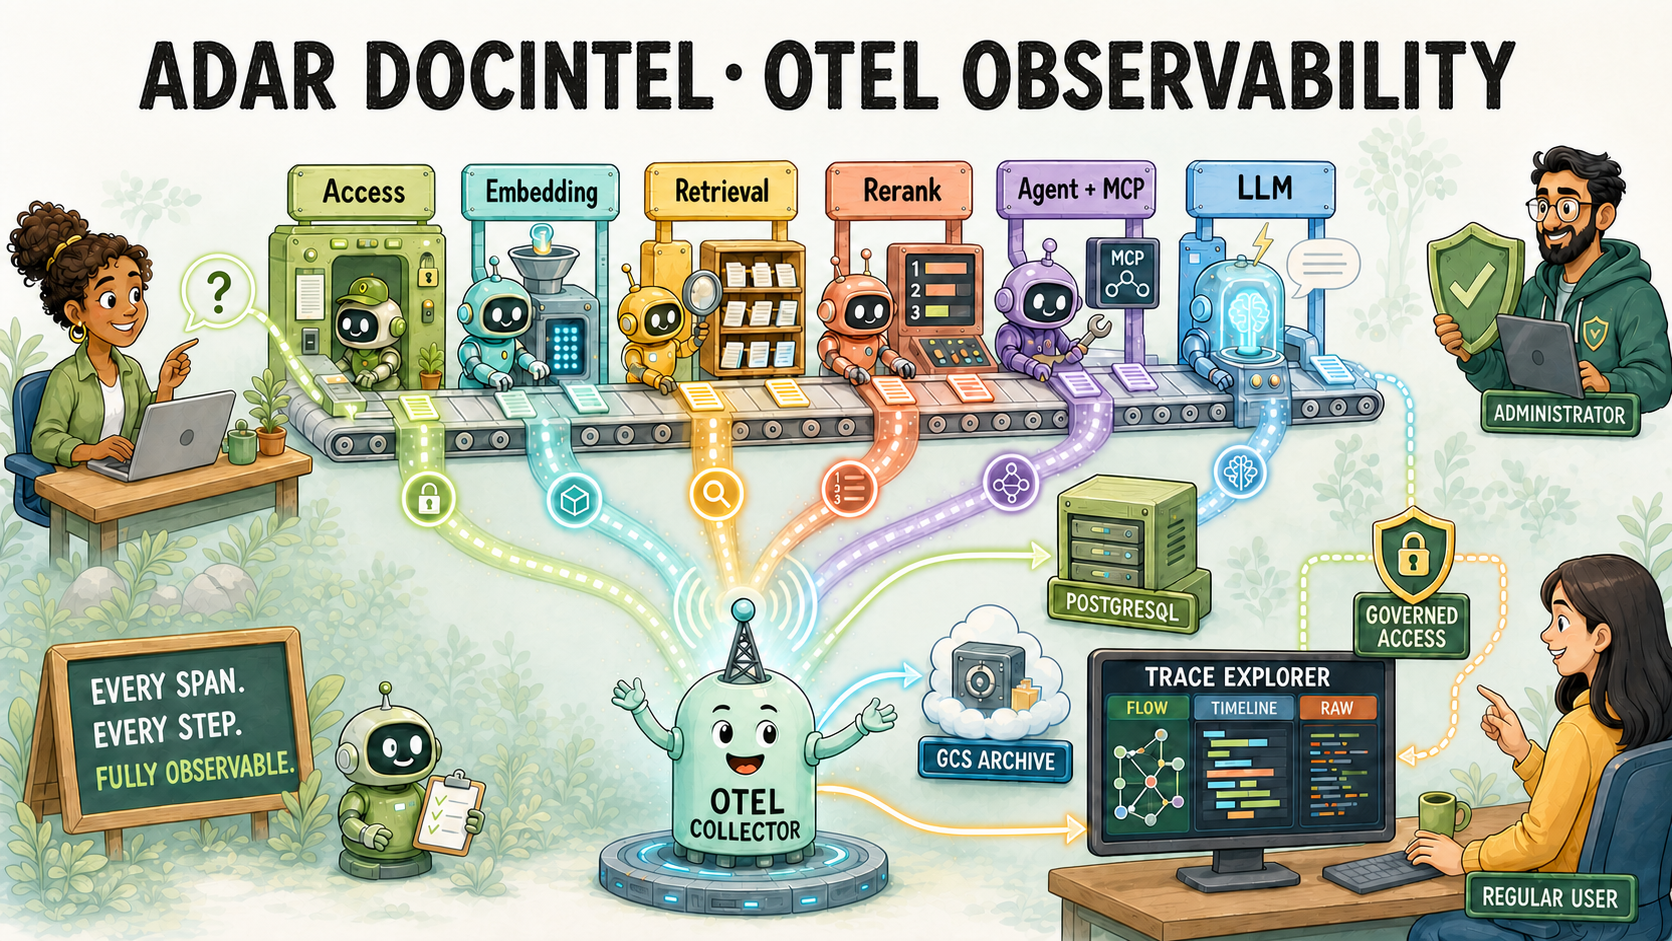
This visual summarizes how ADAR DocIntel makes an AI request observable from access control through embedding, retrieval, reranking, agent and MCP execution, LLM generation, telemetry export, governed storage, and trace review. The same pattern applies to chat, ingestion, embedding, video intelligence, MCP calls, and vertical workflows.
Trace Workflow
When a user asks a question, uploads a file, runs a workflow, or calls DocIntel through MCP, the platform creates a trace that follows the request through the system. The trace includes request type, authenticated user, workspace, session, selected documents, input hash, safe preview, client information, workflow metadata, status, start time, end time, spans, and LLM events. This makes each AI answer easier to debug, verify, optimize, govern, retain, and continuously improve.
Chat, ingestion, embedding, MCP, video, or vertical workflow begins with request metadata and trace context.
Middleware assigns `X-Trace-Id`, connects OpenTelemetry context, and preserves correlation for the UI and APIs.
Decorators and span helpers capture usage checks, embeddings, retrieval, reranking, prompts, agents, models, ingestion, and workflow actions.
Provider, model, operation, tool request, tool response, latency, token signals, finish status, and errors are attached with redaction controls.
Backend and MCP services export spans to the OpenTelemetry Collector through the OTLP HTTP endpoint.
The collector sends traces to Cloud Trace and archives trace data in Google Cloud Storage while Postgres stores the DocIntel UI projection.
Admins and authorized users can review trace flows, spans, durations, statuses, metadata, and LLM events inside DocIntel.
Conversation Trace Example
A sample conversation trace for “what is advised in this packet” shows a successful chat request with document filters, conversation history count, rerank enabled, response language, client details, and a full span sequence. The visible trace turns the answer path into reviewable evidence: usage limit check, query embedding, hybrid retrieval, Gemini rerank, prompt build, agentic context preparation, and final LLM generation.
The same model applies to a lease intelligence question such as “What are the major risks, obligations, and renewal deadlines across these lease documents?” The UI can show the user question, identity and access context, query embedding, hybrid keyword and vector retrieval, evidence reranking, grounded prompt assembly, agent or MCP tool calls, LLM response generation, and final grounded answer.
Shows the complete execution path as connected, selectable stages so reviewers can move from user request to retrieval, tools, model call, and grounded response.
Shows relative start time and latency for each stage, making it easier to find reranking delays, slow model calls, retry patterns, ingestion bottlenecks, or workflow pressure.
Shows readable, color-highlighted trace JSON with a full-screen inspector for deeper debugging, support review, and engineering analysis.
OpenTelemetry UI Demo
This demo walks through the OpenTelemetry Observability UI in DocIntel. It shows how conversations and AI workflows become reviewable through Flow, Timeline, and Raw trace views, including request context, embedding, hybrid retrieval, reranking, prompt construction, agent or MCP tool execution, LLM generation, durations, status, metadata, and model events.
The experience helps administrators, support teams, engineers, and business reviewers understand how a grounded answer was produced, where latency accumulated, what evidence was selected, and which workflow stages succeeded or failed.
Open on YouTubeReliability Operations
The latest DocIntel observability layer turns traces into operational management. Metric rollups, SLO definitions, SLO results, alerts, notifications, and evaluation correlations help teams monitor reliability, latency, retrieval quality, MCP/tool health, model completion, and answer quality without treating every AI workflow as a one-off debugging exercise.
Admin Observability Panel
DocIntel now includes an administrator-facing Observability Panel with four operational views: Overview, SLOs, Alerts, and Quality Correlation. The backend aggregates recent traces into rollups, evaluates service objectives over configured windows, creates or resolves alerts, supports acknowledgement and resolution, and connects trace IDs with evaluation outcomes so reliability and AI quality can be reviewed together.
This matters because a production Agentic AI system is only trustworthy when teams can measure more than uptime. DocIntel can track request success, p95 latency, evidence retrieval, tool reliability, and correlated evaluation quality, while preserving controlled dimensions so telemetry stays useful without exposing prompts, document text, user identifiers, or high-cardinality values unnecessarily.
Request volume, healthy SLOs, breached SLOs, open alerts, quality trend, and scheduler checkpoint status.
Configurable targets for request success, p95 latency, retrieval evidence, tool reliability, and evaluation quality.
Open, acknowledged, and resolved alerts with severity, observed value, threshold value, related SLO, and notification support.
Groundedness, relevance, citation coverage, approval outcomes, and reviewer signals can connect to the exact trace path.
Each automated or human evaluation can carry the originating trace ID. That lets teams answer practical questions: did empty retrieval reduce groundedness, did reranking improve approval rates, which model calls required the most human edits, which MCP tools correlate with failed outcomes, and whether slower traces are producing better or worse answers.
The production path should support head sampling, tail retention for errors and slow requests, PostgreSQL retention windows, GCS archival policies, compression, deletion, legal hold, and collector health monitoring. This keeps telemetry affordable, governed, and useful for audits, support, debugging, and regression comparison.
Rollups can power dashboards for service health, workflow latency, retrieval performance, token consumption, model usage, MCP reliability, tool failures, cost trends, and error patterns. Alerts should focus on regressions that affect users: latency spikes, empty retrieval, failed tools, embedding failures, token spikes, collector backlog, and missing telemetry.
Cross-Product Demo
This walkthrough follows a single request through DocIntel end to end, covering the dual trace IDs, the full span detail behind any stage, and the retrieval-to-generation pipeline chained into one trace, then shows the exact same backbone running ADAR Front Desk: booking conversations scored by a judge agent, the Flow view's tool-call arguments and results, and a full chain of Gemini and tool calls captured end to end.
It closes on how every trace is stored (Postgres, Cloud Trace, and Cloud Storage) and the production SLO targets, request success, p95 latency, and evaluation quality, that turn these traces into ongoing operational management, not one-off debugging.
Watch full screenOpenTelemetry Collector
DocIntel uses standard OpenTelemetry instrumentation while keeping a DocIntel-specific trace projection for product review. This gives engineering teams distributed tracing through OTEL and Cloud Trace, while product admins and business reviewers can inspect request-level traces from the DocIntel UI without needing to understand every infrastructure detail.
Backend and MCP services use the shared `docintel_observability` package to configure OpenTelemetry, instrument FastAPI and HTTPX, create safe span attributes, inject trace headers, and shut down cleanly. Services export spans using OTLP HTTP. In local development the collector listens at `http://localhost:4318`, while the GCP deployment exposes a Cloud Run collector URL with trace ingest at `/v1/traces`.
The collector exports to Cloud Trace for operational investigation and writes a development archive to Google Cloud Storage. Storing traces in GCS is important because it provides durable, cost-efficient telemetry retention for offline review, compliance sampling, debugging, regression comparison, historical analysis, audit support, and incident reconstruction even after short-lived UI sessions or runtime logs have moved on.
http://localhost:4318http://localhost:4318/v1/tracesdocintel-otel-collector${OTEL_ENDPOINT}/v1/tracesgs://${PROJECT_ID}-docintel-otel-devgs://bdas-493785-docintel-otel-dev`trace_flows`, `trace_spans`, and `trace_llm_events` support Admin Trace UI and My Traces review with request metadata, spans, durations, statuses, safe previews, and model/tool events.
Engineering teams can inspect distributed traces across services, MCP gateway calls, HTTP clients, backend spans, latency hotspots, and failures.
Collector archive keeps trace exports available for longer-running audits, historical analysis, operational intelligence, regression review, data retention policy, and incident reconstruction.
`X-Trace-Id` and `X-OTel-Trace-Id` let support, engineering, and platform teams correlate user-visible requests with backend traces.
Implementation Pattern
DocIntel adds observability with shared instrumentation rather than scattering one-off logging everywhere. Async business operations can use `trace_span` when they should appear in both OpenTelemetry and the DocIntel trace UI. Synchronous utility functions can use `otel_span` when they only need OTEL. Existing span calls automatically emit both OTEL spans and the database projection, so older trace UI behavior continues while distributed tracing expands.
The span decorator accepts a stable span name plus optional input and output mappers. That means the system can capture useful operational facts such as document ID, chunk count, page count, candidate count, top K, provider, model, workflow run ID, packet type, or status without storing raw secrets or full content by default.
Safety defaults matter. Content-like attributes such as prompts, questions, chunks, responses, and document text are stored as hashes and lengths unless explicit content capture is enabled. Authorization headers, passwords, API keys, access tokens, refresh tokens, internal prompts, sensitive metadata, and unrestricted tool payloads stay protected by default.
from services.tracing import trace_span

@trace_span(
    "document.extract",
    input_mapper=lambda document_id, **_: {"document_id": document_id},
    output_mapper=lambda result: {"page_count": result.page_count},
)
async def extract_document(document_id: str):
    ...

# Existing spans are projected into Postgres and OTEL.
async with span("hybrid_retrieval", metadata={"fetch_k": 20}):
    ...

# Synchronous utilities can use OTEL-only spans.
@otel_span("video.frame_sampling")
def sample_video_frames(video_id: str):
    ...
Enterprise Personas
Agentic AI reliability is not determined only by the final model call. It depends on the complete system: authorization, context engineering, document selection, embeddings, retrieval quality, evidence ranking, tool execution, prompt construction, model generation, approvals, packet creation, and governance. Observability helps organizations trust this complexity by showing what happened, how long it took, which evidence path was used, where failures occurred, and which human or automated step changed the outcome.
Validate distributed traces across frontend requests, MCP gateway calls, backend APIs, retrieval services, model providers, batch jobs, and workflow orchestration.
Debug latency, timeouts, failed spans, model errors, retrieval gaps, upload issues, video processing delays, and batch workflow bottlenecks.
Review redaction posture, trace IDs, user context, workspace scope, access path, request status, and audit visibility without exposing secrets by default.
Use system-wide Admin Trace visibility to answer what happened during a user conversation, ingestion run, summary, comparison, workflow, approval, or PDF packet generation.
Use My Traces to inspect their own requests through the same visual workflow while system prompts, unrestricted tool payloads, credentials, and internal metadata remain protected.
Gain confidence that healthcare, finance, talent, lease, restaurant, video, and other vertical workflows are reviewable rather than opaque automation.
See that DocIntel is built for governed scale with measurable reliability, operational review, and accountable AI execution.